Published: Jul 14, 2022Time to read: 5mins Category: Insights
Visualizations and Metrics That HR Leaders Love
We all know the saying, “A picture’s worth a thousand words.” While pictures are nice, it's the numbers that really tell the story. Whether you’re presenting the results of the last quarter to your leadership team or trying to brainstorm where you can better address company initiatives—such as employee pay programs—the data is what really matters.
Even so, complex data can be difficult for people to understand. You likely have a firm handle on the material as the presenter, but others on your team may not have the same background knowledge. They could use some help interpreting the information. In these instances, it’s much easier to get your point across with a visual story.
Visualizations help others comprehend information, and various people analytics tools will have a range of visualizations and metrics. We’ve outlined some of the best workforce analytics tools available that HR leaders stand behind to help you tell your data story.
JUST FOR YOU | ‘5 Questions That Get to the Heart of Why People Analytics Matters’
What Makes Strong Storytelling in Analytics?
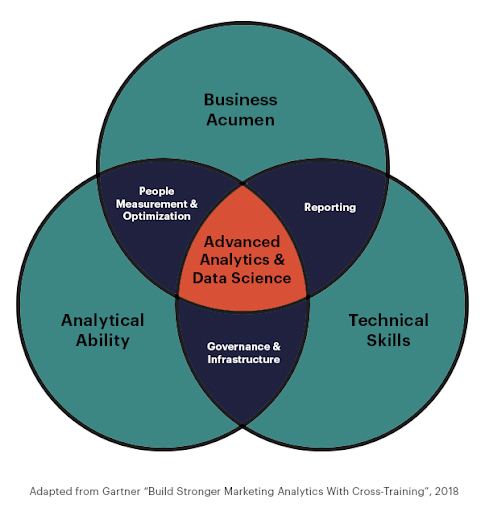
The strongest storytelling comes from neatly blending business acumen, analytical ability, and technical expertise. Most HR practitioners have a strong understanding of the opportunities and risks for their organizations. They realize the important role that human resources plays in driving business outcomes.
Having strong business acumen is vital to delivering your message, but it’s not the only thing you need to tell your story well. You also need to have the ability to articulate and solve problems or answer questions with data.
It won’t be enough to simply show your team a visual of the data. They’ll have questions about how the information will impact areas of the business, and they’ll want to know how to use the analytics to solve organizational problems. Additionally, you’ll need to have thorough knowledge of and experience with the tools that are being used to collect and manage your data.
The good news is that you don’t need to be a data scientist to hone your technical skills or gain an accurate understanding of analytics. The right HR platform will integrate simple—yet powerful—analytics tools for compensation, performance, and succession planning that boost your analytical ability and technical skills.
FROM THE BLOG | ‘How Data About Your High Performers Is the Key to Fairer Compensation & Greater Retention’
3 Analytics Tools That HR Leaders Love
To tell the best data story, you’ll need the best analytics tools. The following features will give you the visualizations and metrics you need to share your data story with key stakeholders and ensure you have a happy, stable workforce.
1) Actual Compensation, Budgeted Compensation, and Net Change Compensation
Keeping track of the amounts that have been promised to employees, and when—or if—these amounts will be delivered to them, is key to ensuring that the business manages its spend on people, while maintaining alignment with the expectations set out in the business plan. Compensation analytics give you a consistent and detailed view of how compensation commitments are changing, helping everyone in the business better manage this crucial area of spend.
Compensation analytics offer insight that goes far beyond what to budget for payroll.
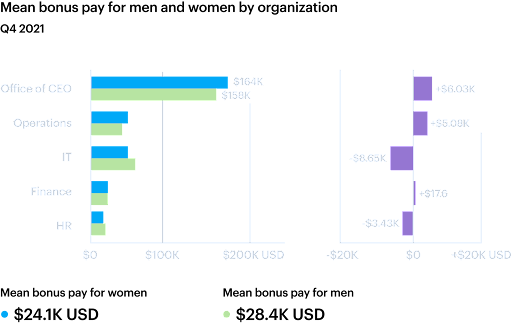
For example, you can discover how pay may be disparate between genders of different teams and by how much, so you can report back to management. Organizational leaders need to know how teams compare when it comes to overall compensation. They also should know how payroll breaks down into compensation types, such as base pay, commission, and overtime.
2) Performance Review Completion and Average Review Outcome
It’s important to know what your workforce is up to and which employees have the bandwidth to handle additional responsibilities, especially if there’s a need to tweak the levers of production. That’s where performance analytics comes in to play.
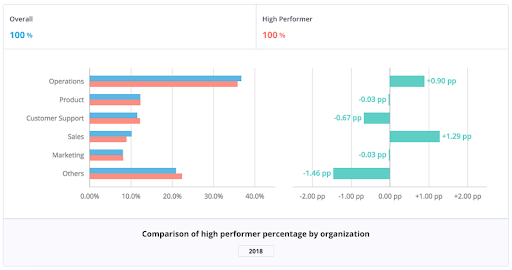
The employee provides a review of themselves, and their manager reviews their results and provides feedback on progress and improvements. Using this information, you’ll gain insight into which employees are responsible for bringing in the most revenue, producing high-quality products, and driving value and productivity.
Differentiating performance groups is especially important when tackling compensation and retention so you can be confident that your highest performers are compensated fairly.
MORE ON PERFORMANCE | ‘How to Leverage Technology to Drive a Productive and Engaged Workforce’
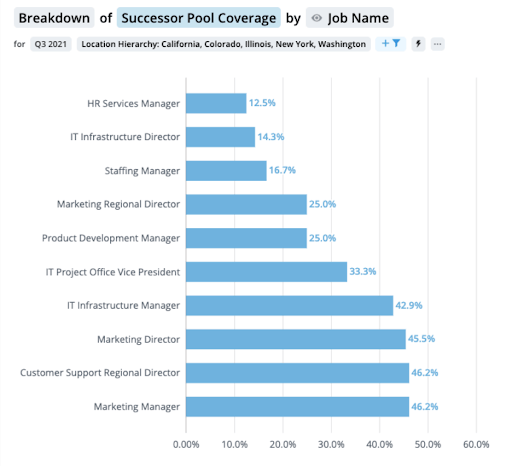
3) Succession Coverage Ratio
Succession planning and reporting happens only once a year for many organizations. We believe that this is not sufficient.
The rate of change in business and in the employee set suggests that succession planning should happen quarterly, or if possible, at least monthly. On-demand availability of succession coverage ratio reporting lets you quickly capture and understand changes so you can take timely action.
HR leaders need to be able to communicate the organization’s risk levels to the executive leadership team and board of directors. Succession reporting allows you to monitor and understand the current and potential future risks for various positions within the organization. The data also helps you track and take action when those risks become too great.
Strengthen Your Data Story With Strong Analytics
Deciphering analytics can feel intimidating at the onset, but the right tools will give you the clarity you need to share your narrative with stakeholders in a way that’s easy to digest and comprehend. Strong analytics tools allow you to visualize your employee data and provide leaders with clear information about what’s happening in their organization.
With data tools for compensation, performance, and succession, you can spend less time sifting through data and more time making decisions that are best for your organization—and your employees!
SEE COMPENSATION IN ACTION | ‘Coffee Beans Can Add Up Too’
Use Your Data to Your Advantage
Learn how you can make your data work for your organization at any skill level with analytics products from PeopleFluent. Contact our sales team today!
